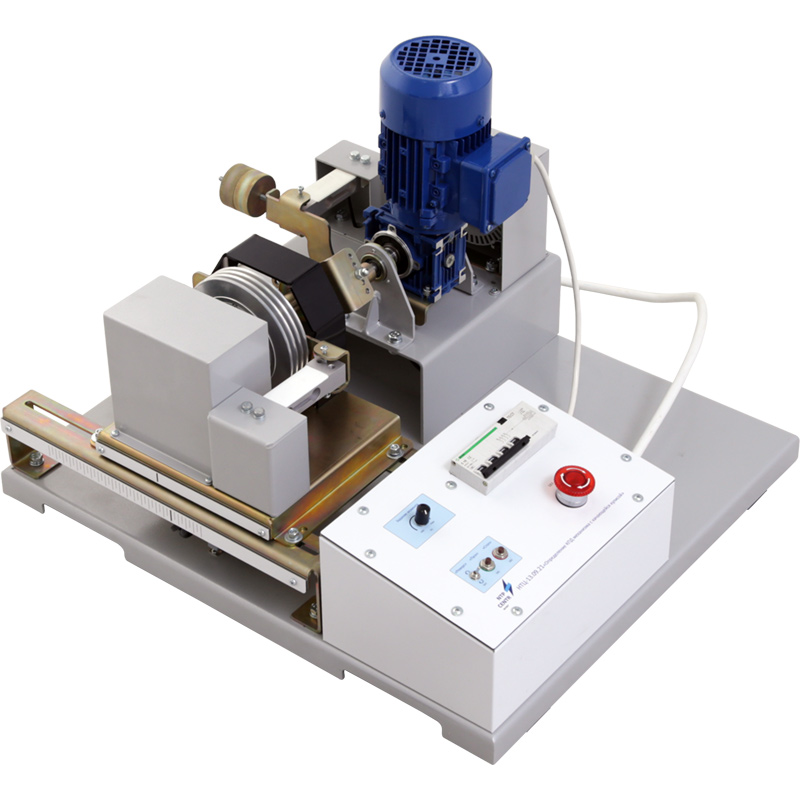
A crank with a “rocker stone” is fixed on the shaft of the gearmotor, inside which the rocker moves. The second end of the wings is mounted on the shaft of the brake mechanism. The gear motor is located in movable bearings, allowing the gear motor to rotate around the axis of the shaft. The magnetic powder brake is located in movable bearings, allowing the brake to rotate around the axis of the shaft. The load is controlled by an electronic controller controlled by the controller.
Strain gauge force sensors are mounted on the supports of the gearmotor and the brake, which allow recording reactive moments on the shafts of the gearmotor and the brake. Angular displacement sensors are fixed on the shafts of the gearmotor and the brake, which allow recording the rotational speed of the gearmotor and brake shafts.
On the frame there’s is a control unit with an electronic device for analysis and information processing. Information from angular displacement sensors and strain gauges is processed by controlled amplifiers. Data is sent to the controller, which controls the amplifiers and exchanges information with the computer via the USB 2.0 bus.
Functionally the front panel of the control unit is divided into the following blocks:
- circuit breaker unit that contains reusable fuses to protect the drive motor from overload and a stand emergency shutdown button;
- engine control unit that includes buttons for starting and stopping the engine, respectively. The control unit does not allow to start the engine with the protective cover raised;
- the unit of the regulator of the load torque of the electromagnetic clutch, which allows you to adjust the load moment on the shaft of the drive clutch using potentiometer.
The training system is accompanied with :
- a set of teaching materials and technical documentation intended for the teaching staff;
- a software that allows you to save instantaneous values of angular velocities and torques on the shafts of the gear motor and the brakes in a file on the disk for further processing. Using the software, the values of efficiency and angular velocities are displayed on a PC monitor in the form of graphs and an array of values.